
Most engineering teams have no shortage of numbers to look at. Velocity points. Sprint completion rates. Bug counts. Test coverage percentages. Lines of code committed per developer per week. If you want data about how a software team is performing, you can generate it almost endlessly.
The problem is not the quantity of data. It is that most of it measures activity rather than outcomes. A team can have excellent velocity numbers and terrible reliability. A team can have high test coverage and still ship regressions every other week. A team can close tickets quickly and still take three days to recover from a production incident.
DORA metrics cut through the noise. They do not measure how busy a team is. They measure how well a team is actually delivering software, and those are meaningfully different questions.
Where DORA Metrics Came From
The DORA metrics came out of the DevOps Research and Assessment program, which spent years studying what separates high - performing engineering teams from low-performing ones. The research covered thousands of teams across industries and found that four specific measurements consistently predicted whether a team was delivering software reliably and efficiently.
What made the research significant was what it did not find. Team size, years of experience, budget, and technology stack did not consistently predict performance. What did was how teams approached deployment, how quickly they could recover from failures, and whether they maintained stability while moving fast.
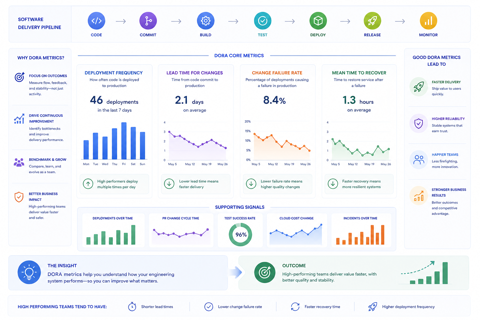
The four metrics that emerged from this research are deployment frequency, lead time for changes, change failure rate, and mean time to recovery. Together they create a picture of delivery performance that activity metrics simply cannot capture.
Deployment Frequency
Deployment frequency measures how often a team releases code to production. High-performing teams in the DORA research deploy multiple times per day. Low-performing teams deploy once a month or less frequently.
The instinct many teams have is that deploying frequently is riskier than deploying rarely. This turns out to be backwards. Teams that deploy frequently ship smaller changes. Smaller changes are easier to review, easier to test, and easier to roll back when something goes wrong. Teams that deploy rarely batch up large amounts of change into each release, which makes each deployment a higher-stakes event.
There is also a feedback loop effect. Teams that deploy frequently get faster feedback from real users about whether what they built actually works. Teams that deploy monthly are waiting up to thirty days to find out whether their work landed well. By the time they get that signal, the developers who wrote the code have moved on to other things.
Improving deployment frequency is rarely a technical problem in isolation. It usually requires addressing the organizational habits and approval processes that make teams reluctant to ship. When teams ask why they are not deploying more often, the answers are usually things like "we need sign-off from three stakeholders" or "we batch releases because the deployment process is painful" - process and culture problems more than technical ones.
Lead Time for Changes
Lead time measures the time between a developer committing code and that code running in production. It captures how long the path from development to delivery actually takes.
Short lead times mean teams can respond quickly to user feedback, fix bugs before they compound into larger problems, and iterate on features based on what they learn from real usage. Long lead times mean good ideas sit in queues, bug fixes take days to reach the users experiencing the problem, and the gap between what the team built and what users actually need keeps widening.
The interesting thing about lead time is where it actually accumulates. Most teams assume the slow part is writing the code. It almost never is. The slow parts are the handoffs - waiting for code review, waiting for test environments to be available, waiting for deployment approval, waiting for the pipeline to run. The code itself usually gets written faster than any of the gates between writing and shipping.
Teams that have meaningfully reduced their lead time have almost always done it by eliminating or automating handoffs rather than by making developers write code faster. Automated testing that runs immediately on commit, deployment pipelines that require no manual approval for standard changes, code review processes that prioritize throughput - these are the interventions that move lead time.
Change Failure Rate
Change failure rate measures the percentage of deployments that cause a problem requiring intervention - a rollback, a hotfix, or an incident response. It is the metric most directly connected to the question everyone actually cares about: how often does the team ship broken software?
A low change failure rate means the team has good mechanisms for catching problems before they reach users. A high change failure rate means problems are getting through - either because the testing is inadequate, the code review process is not catching issues, or the deployment process is introducing problems that were not present in the development environment.
What makes change failure rate particularly useful is that it puts deployment frequency in context. A team that deploys one hundred times a week with a two percent change failure rate is shipping two broken deployments a week. A team that deploys once a week with a twenty percent change failure rate is also shipping broken software, just less often. The numbers look different but the underlying quality problem is similar.
Teams often focus on reducing deployment frequency when they see a high change failure rate, reasoning that fewer deployments means fewer opportunities for failure. The DORA research consistently shows this is the wrong response. The right response is to understand why changes are failing and fix the underlying cause, then continue deploying frequently once the cause is addressed.
Mean Time to Recovery
Mean time to recovery measures how long it takes to restore normal service after a production incident. It captures organizational resilience - not just whether things break, but how quickly the team can get back to normal when they do.
No system is perfectly reliable. Hardware fails, third-party services have outages, bugs get through testing. The question is not whether incidents will happen but how well-prepared the team is to respond when they do.
Teams with low mean time to recovery share some consistent characteristics. They have good observability - they can tell quickly what broke and why. They have practiced incident response - people know their roles and the process does not need to be invented in the moment. They have deployment architectures that support fast rollback - they can undo a bad deployment in minutes rather than hours.
Teams with high mean time to recovery often struggle with the opposite. Monitoring that tells them something is wrong but not what or where. Incident response that depends on whoever happens to be available rather than a clear process. Deployment setups that make rollback complicated enough that teams prefer to push a fix forward rather than roll back.
Mean time to recovery is the metric most improved by investment in observability and incident response practice rather than by changes to the development process. Teams that run regular game days - deliberately simulating incidents to practice response - tend to have significantly lower recovery times than teams that only encounter incidents in production.
Reading the Metrics Together
The real power of DORA metrics is not in any single measurement but in how they relate to each other. A team with high deployment frequency and high change failure rate is shipping fast but breaking things frequently - the speed is not earning its keep. A team with low lead time and high mean time to recovery is moving fast but fragile, they can ship quickly but cannot recover gracefully when something goes wrong.
The pattern that characterizes genuinely high-performing teams is all four metrics moving in the right direction simultaneously. High deployment frequency. Short lead time. Low change failure rate. Fast mean time to recovery. These teams are not trading speed for stability or stability for speed. They have found the practices that produce both.
Getting there from wherever a team currently sits is not a single intervention. It is a series of improvements to testing, deployment, observability, and organizational process - each of which moves one or more metrics and creates the conditions for further improvement.
The value of measuring these specific things is that they keep improvement efforts pointed at outcomes rather than at activity. A team that is genuinely improving its software delivery will see these numbers move. A team that is busy but not improving will see these numbers stay flat regardless of how much work is getting done.
That is what makes DORA metrics worth tracking. Not because they are the only way to understand engineering performance. Because they measure the right things.
0 件のコメント
この投稿にコメントしよう!
この投稿にはまだコメントがありません。
ぜひあなたの声を聞かせてください。